The Butterfly Effect: Why the weather is difficult to predict, but the climate is not
A brief introduction to chaos theory. How pure physics shows that every weather forecast has its limits, and why that doesn't say anything about the climate.
One of the recent posts discussed climate models—why there are so many of them and why they differ, especially when it comes to clouds. In that case, the uncertainty stemmed from the physics, which is not yet fully understood. Here, we’re dealing with a different limitation, one that is much more fundamental. It has nothing to do with the quality of the models or the power of the computers. It lies in the weather itself. Behind this lies a sound physical theory: deterministic chaos. It is considered complex, yet it can be understood from a single image. And it is established physics, Level 1.
An accidental discovery
Edward Lorenz, a meteorologist at MIT, discovered the effect around 1961 while running a weather model with twelve variables on a computer. When he restarted a calculation, he entered an intermediate value to three decimal places instead of six. He expected the same outcome but received a completely different one. A tiny difference in the fourth decimal place had grown so large over the simulated time that it completely overturned the entire result. Two years later, in 1963, Lorenz distilled the behavior into three simple equations that exhibit the same effect. They are known today as the Lorenz system.
That is the crux of the matter. Experts call it sensitive dependence on initial conditions; in popular parlance, this has become known as the butterfly effect, likened to a flutter of wings that shifts the weather far away. A fact that surprises many is key to understanding this. There is no randomness in these equations. They are entirely deterministic. The unpredictability is not noise in the data; it is built into the system itself.
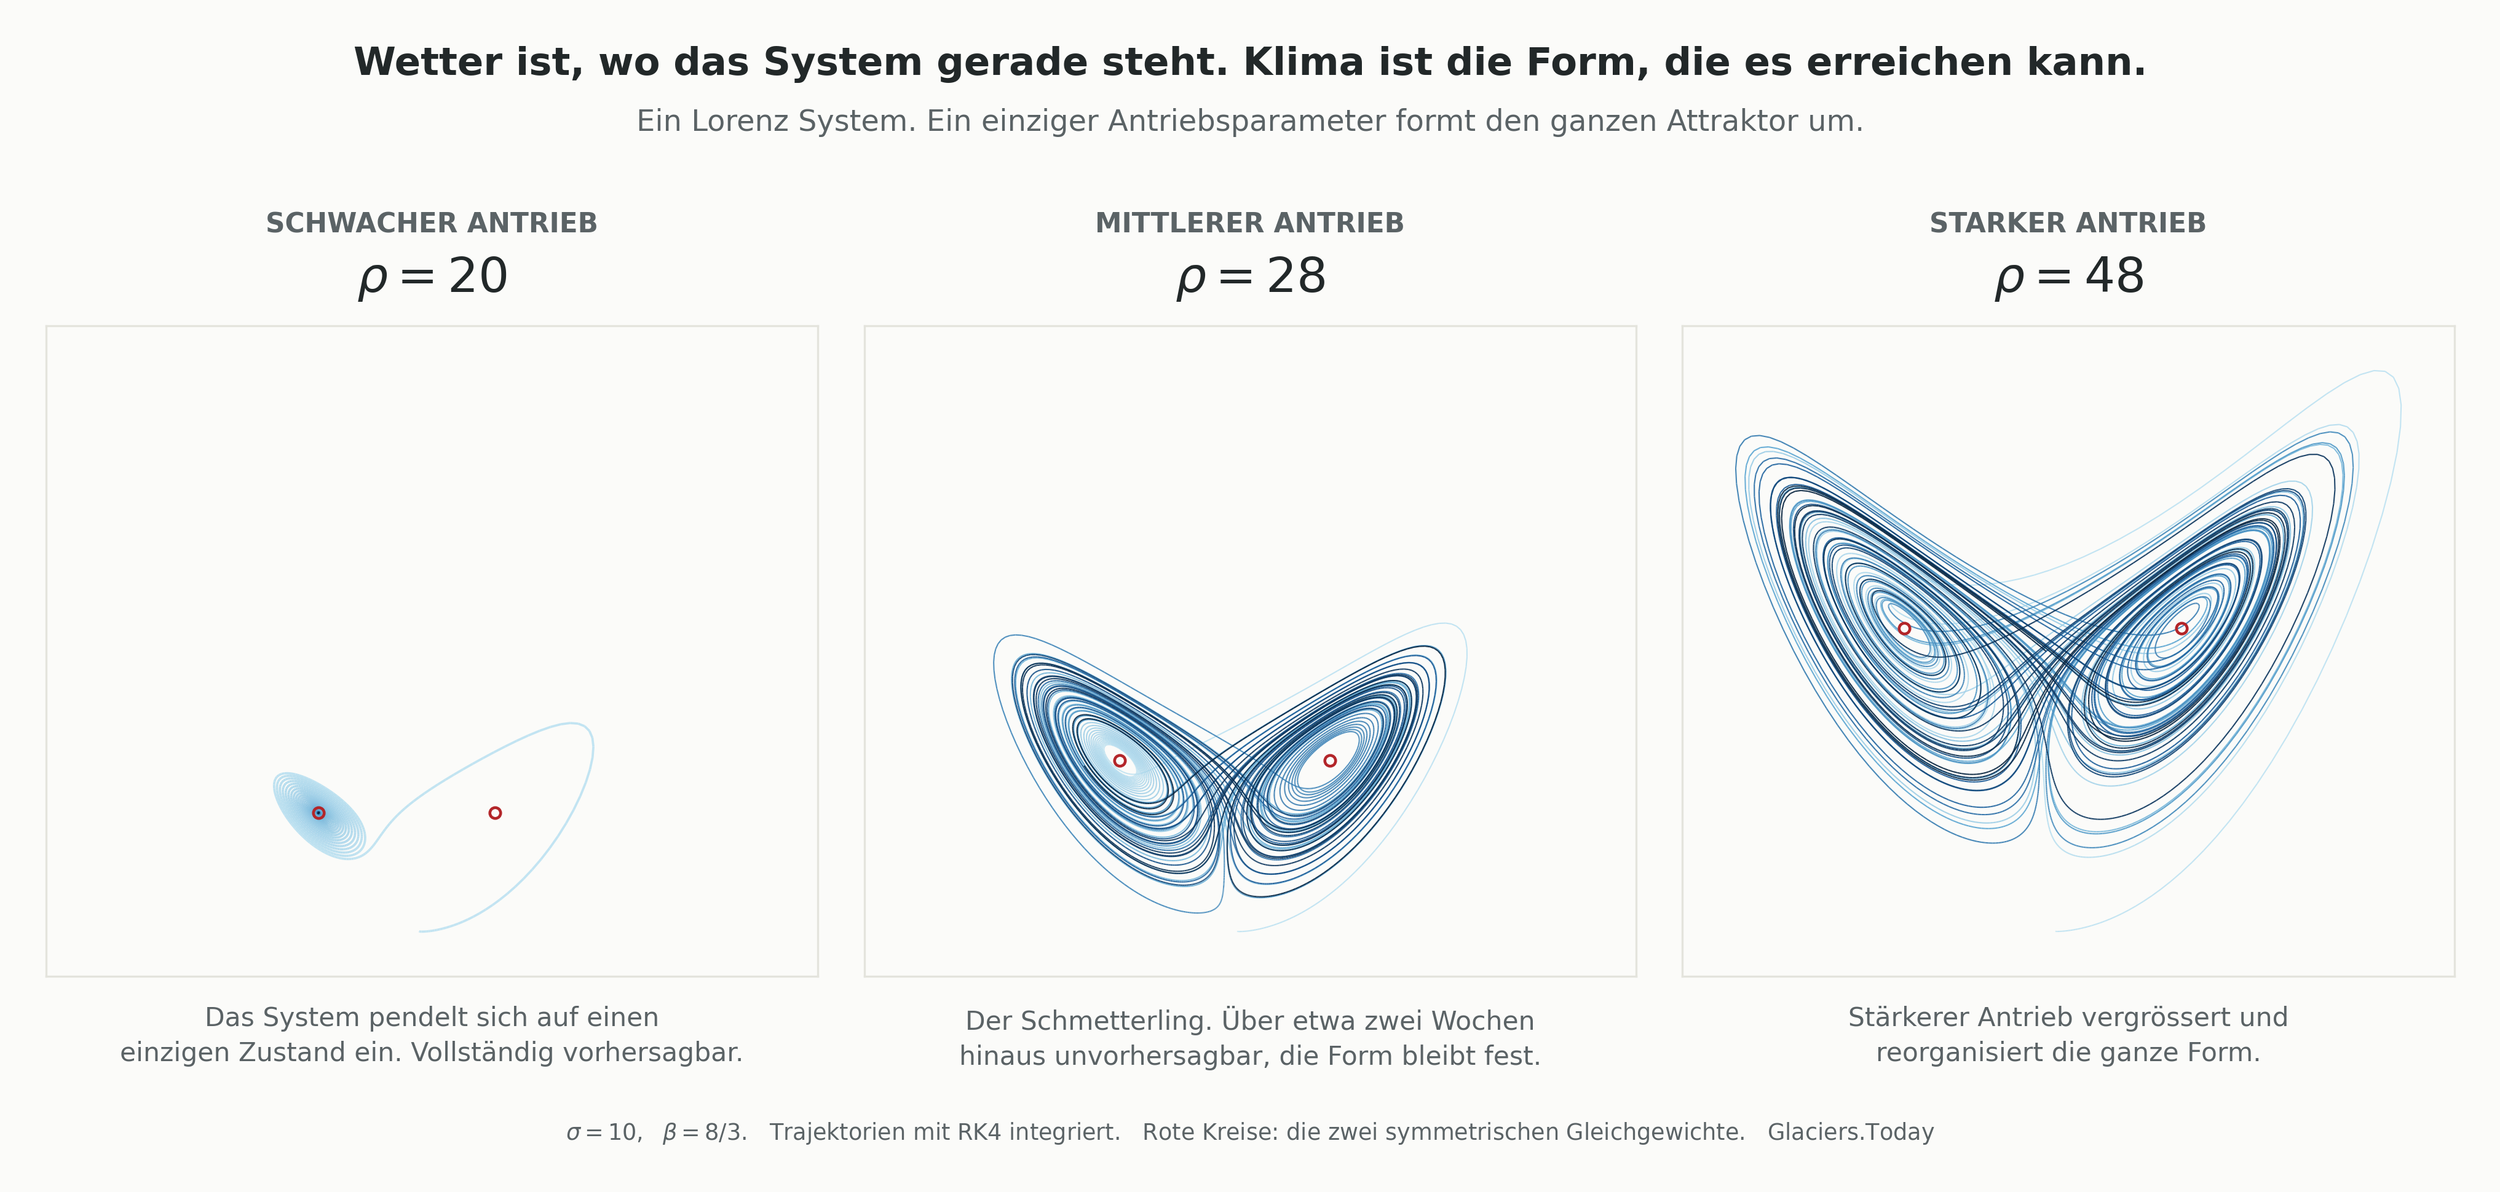
The Lorenz system with increasing drive. With a weak drive, the system settles into a single state. At a moderate drive level, the butterfly pattern emerges; the trajectory becomes unpredictable beyond about two weeks, but the overall shape remains stable. If the drive is increased further, the entire pattern expands and reorganizes itself.
The Butterfly
If you trace the path of these equations over time, it never repeats itself and never comes to rest. Nevertheless, it never leaves a fixed, butterfly-shaped region. This region has a name. It is called an attractor.
The two wings represent two states around which the system oscillates. It jumps back and forth between them, and it is impossible to predict how many cycles it will complete before each jump, even though the equations are completely determined.
Lorenz Attractor
Deterministic chaos arising from three coupled equations. σ=10, ρ=28, β=8/3 produce the classic butterfly.
Drag to rotate. show twin launches a second particle one millionth of a unit away from the first, so you can watch two nearly identical particles diverge. That is the butterfly effect.
Two statements, both true
Now here’s the crucial point. The exact path through the butterfly can only be predicted over a short time frame. The shape of the butterfly itself, however—its size, its boundaries, its two wings, and how often the path passes through each region—is completely stable and reproducible.
The weather is where the dot is currently located on the butterfly. Beyond about two weeks, this can no longer be determined. This limit dates back to forecast research in the 1960s, particularly to Charney and colleagues in 1966. More recent studies using better models shift it only slightly, to about 15 to 17 days. Faster computers do not change this, because the limit lies within the system itself.
A state space is the shape of the butterfly. It is the set of all possible states the system can assume, and the frequency with which it visits each one. This is well known, even if the next step is not.
So climate is not a long-term weather forecast. It is a statement about the state of the entire system. The two-week limit and a predictable climate are not mutually exclusive. They are two different issues.
The drive button
One of the parameters in the model, denoted by the Greek letter rho, represents the strength of the system’s heating and, consequently, its driving force. In fluid dynamics, this is known as the Rayleigh number. Rho should be understood as a simple analogy to the greenhouse effect, not as the same thing. Turning this knob higher does not improve the forecast for next Tuesday. It shifts the entire butterfly, exactly as the three images show. With weak driving, the system settles into a single state. At the familiar medium value, the butterfly appears. If you turn it further, the shape grows and rearranges itself.
When it comes to the climate, that sums up the whole idea in a single sentence. A changed driving force does not alter the forecast; it alters the distribution. It shifts the mean values, it widens and shifts the range, and above all, it reshapes the edges—where the rare and costly events lie. Beyond a certain threshold, the pattern can completely reorganize itself; that is the simple form of a tipping point. None of this requires predicting a single day.
Why Prediction Is So Difficult
That is precisely why major weather services, such as the European Centre for Medium-Range Weather Forecasts (ECMWF), have long since stopped producing a single forecast. They run many forecasts, each based on a slightly different initial condition, and present the range of results as a probability. This is called an ensemble forecast. The honest message behind it is that forecasting is really difficult.
And here, caution is warranted on both sides. Anyone who interprets a single warm week as a major trend is just as mistaken as someone who declares the end of global warming after a cold snap. Both are confusing a moment on the butterfly’s wing with its shape.
Where the real boundaries lie
There are two caveats to keep in mind, because making too many claims destroys trust more quickly than admitting one’s limitations ever could.
First, the 1963 model is a simplified model with three equations. Real climate models involve millions of variables, and because the driving forces themselves change over time, the strict notion of a single fixed attractor becomes more nuanced and difficult to maintain. The bold claim that the climate is a fixed attractor is itself a model statement from Layer 3, and we do not rely on it.
Second, only the fundamental principle of the Lorenz model is relevant—and only the part of it that is undisputed.
The chaos sets a strict upper limit on the weather forecast, at around two weeks.
Climate is the statistical behavior of the system, independent of any individual forecast.
If you change the drive system, these statistics change, the averages shift, and the extremes are reshaped.
The glacier takes its toll
The glacier isn’t concerned with any single forecast or heat wave. It takes the entire season into account—winter snow against summer melt—and records the final result. That is precisely why our archive is so valuable. Since July 2023, an image has been captured every 30 minutes from the same spot at 3,092 meters on the Diavolezza, complete with date and time—a patient record of Pers and Morteratsch. This quiet log allows us to verify the loud headlines of the week. We show what is. We leave the forecasts to others.
Look. Hold on. Pass it on.
Sources
Edward N. Lorenz, “Deterministic Nonperiodic Flow,” *Journal of the Atmospheric Sciences*, 1963. The paper featuring the three equations and the attractor. AMS
Lorenz had already discovered this sensitive dependence around 1961 while working on a weather model with twelve variables, when he rounded an intermediate value of 0.506127 down to 0.506. MIT Technology Review, American Physical Society
The estimate of approximately two weeks was first proposed by J. G. Charney and colleagues in 1966. More recent studies, including those by Zhang and colleagues in 2019 and Judt in 2018, slightly extend the theoretical limit to about 15 to 17 days. Overview of predictability, NOAA Repository
The term "butterfly effect" dates back to a 1972 lecture; the title was coined by Philip Merilees. Britannica
The Hopf point at approximately 24.74 explains why the system is stable at rho 20 but chaotic at 28 and 48. See Wikipedia, "Lorenz system," and Steven Strogatz, *Nonlinear Dynamics and Chaos*.
Warwick Tucker proved in 2002 that the shape of the attractor is stable and reproducible. Springer, Foundations of Computational Mathematics, Nature
Previous article on Glaciers.Today: Climate models, what they calculate, and why there are so many. glaciers.today
Ensemble forecasting is the standard method used by major weather services, including the European Centre for Medium-Range Weather Forecasts (ECMWF). ecmwf.int
Graph, glaciers.today. Lorenz system, integrated using a fourth-order Runge-Kutta method, sigma = 10, beta = 8/3, rho at 20, 28, and 48.