The Vostok ice core drillings: 420,000 years of climate history from the depths of Antarctica
How a 3,623-meter-deep ice core revealed the relationship between CO₂ and temperature.
Deep within East Antarctica, in one of the coldest places on Earth, lies the Russian research station Vostok. It was here, in 1983, that the lowest natural temperature ever recorded was measured: −89.2 °C. But it is not the extreme cold that makes this place so significant for science, but rather what lies hidden beneath the massive ice sheet: a climate archive of unprecedented scope. Over the course of decades, Russian, French, and American research teams have drilled into the Antarctic ice at the Vostok Station, retrieving an ice core that contains the climate history of the past 420,000 years—layer by layer, frozen in time.
The findings from this ice core are of fundamental importance for understanding what is happening to our planet today. They reveal a close link between CO₂ concentrations and temperatures over hundreds of thousands of years—and they show that today’s atmospheric CO₂ levels exceed anything ever recorded in this archive.
The Station and the Ice
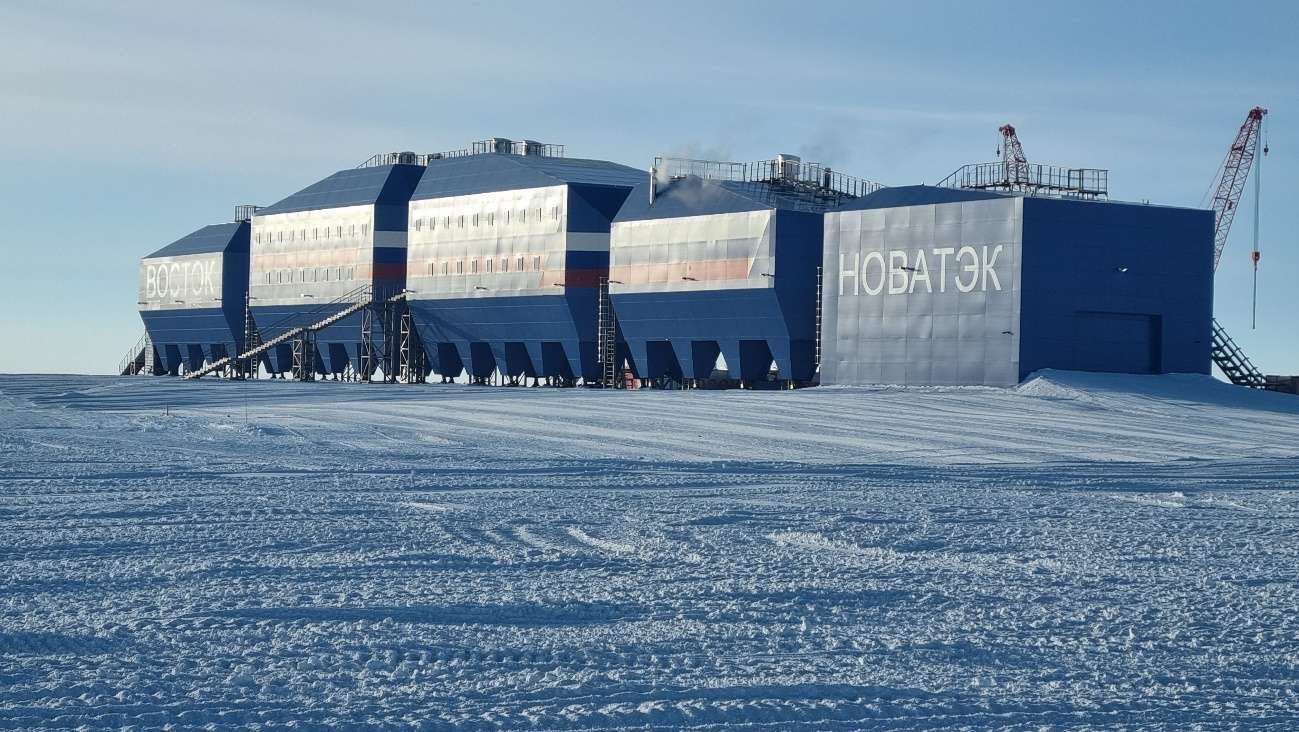
Vostok Station 2024, Wikipedia cc: Arctic and Antarctic Research Institute
The Wostok Station was established by the Soviet Union on December 16, 1957, during the International Geophysical Year. It is located at 78°28' South, 106°48' East, at an elevation of 3,488 meters above sea level—in the middle of the East Antarctic Ice Sheet, one of the largest contiguous ice sheets on Earth.
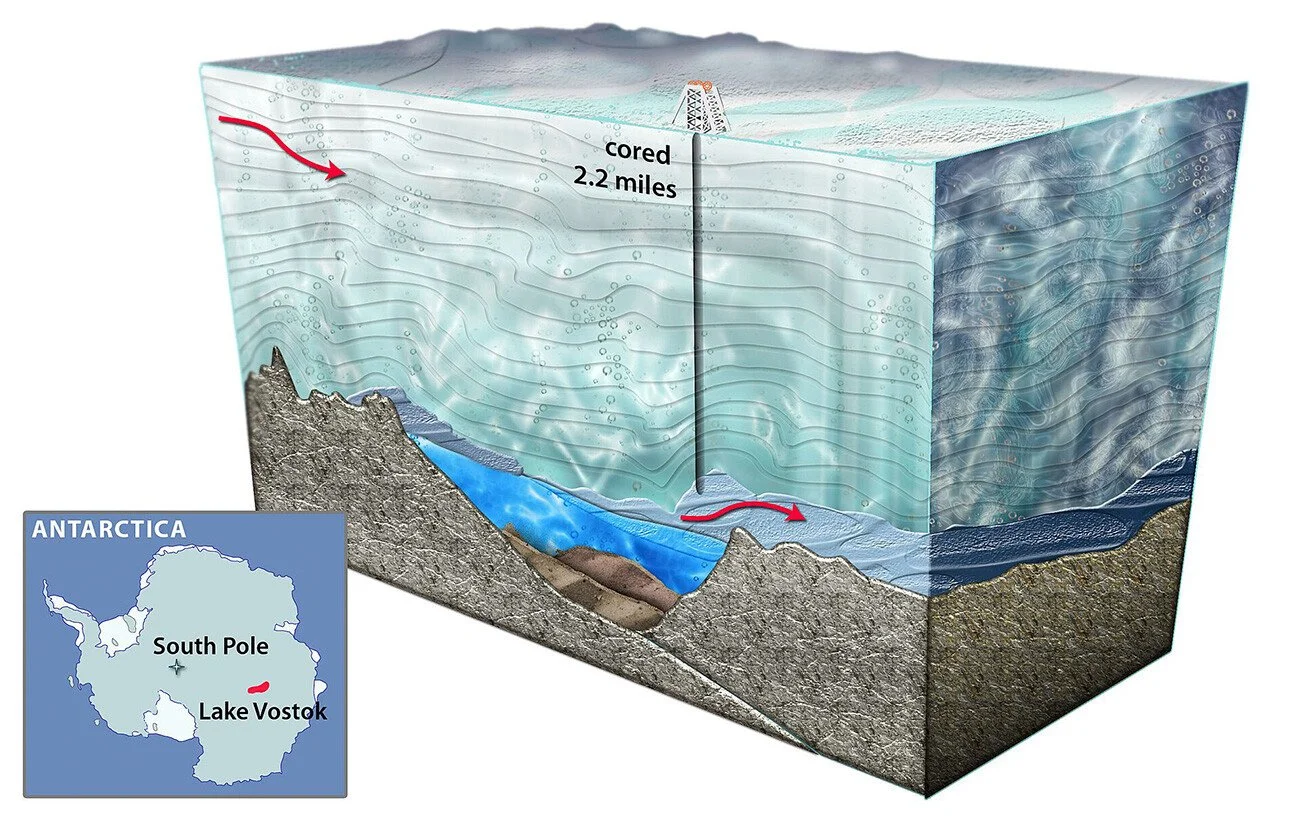
The site is ideal for ice core research for several reasons. First, it is one of the thickest parts of the East Antarctic Ice Sheet—over four kilometers thick. Second, the ice here is relatively undisturbed: there are hardly any ice currents that could disrupt the layering, and conditions are stable enough that the annual layers have been preserved for hundreds of thousands of years. Third, beneath the entire ice sheet lies Lake Vostok—a massive subglacial freshwater lake the size of Lake Ontario that has been isolated from the rest of the Earth’s surface for at least 15 million years.
The History of Drilling
The ice core drilling at the Vostok Station is among the most ambitious scientific endeavors in the history of polar research. Begun in the 1970s, the project spanned several decades and overcame immense technical challenges posed by the extreme climatic conditions.
1970 – The first deep drilling operation begins at the Vostok Station. The drill core reaches a depth of 506.9 meters.
1970s–1980s – Several consecutive ice cores are extracted. In 1985, Wostok 3 reaches a depth of 2,202 meters and is the first core to contain ice from the penultimate ice age—around 150,000 years ago. A fire at the station temporarily interrupts work in 1982.
1990 – Work begins on a new, even deeper borehole (Borehole 5G). It is a joint project between Russia, France, and the United States.
January 1998 – A historic milestone: The ice core reaches a depth of 3,623 meters. At the time, it is the deepest ice core ever extracted. Drilling is halted approximately 130 meters above Lake Vostok to prevent contamination of the underground water.
1999 – Jean-Robert Petit and an international team publish a groundbreaking study in *Nature* that reconstructs 420,000 years of climate history from an ice core—spanning four complete glacial cycles.
2012 – Russian scientists penetrate the final layer of ice at a depth of 3,769.3 meters and reach the surface of the subglacial Lake Vostok for the first time. The lake water, under high pressure, shoots up into the borehole and freezes—thus sealing off access.
How the ice reveals its secret
An ice core is much more than just frozen water. It is a physical archive of the Earth’s atmosphere. Every year, new layers of snow settle on top of the previous ones. Under the weight of the snow above, the material first compacts into firn and eventually into ice. During this process, tiny air bubbles become trapped—“fossil air”—which provides a direct snapshot of the atmosphere at that time.
By analyzing these air bubbles, scientists can determine the concentrations of greenhouse gases such as CO₂ and methane (CH₄). Temperature is reconstructed indirectly by measuring deuterium isotopes (δD) in the ice. The principle is based on the fact that heavier water molecules evaporate more easily at warmer temperatures and thus end up in precipitation. The ratio of heavy to light water in the ice is therefore a reliable indicator of temperature.
Good to know: The air bubbles do not seal off at the ice surface, but only at a depth of about 90 meters, where the firn turns into impermeable ice. As a result, the trapped air is younger than the surrounding ice—during cold periods, the age difference can be as much as 6,000 years.
In addition, the ice core provides information about volcanic eruptions (through layers of ash and acid), cosmic radiation (via beryllium-10 isotopes), dust concentrations that indicate aridity and wind conditions, as well as past biological activity.
The key findings
The study by Petit et al., published in *Nature* in 1999, was a scientific sensation. For the first time, a complete climate record was available that spanned four full cycles of glacial and interglacial periods—each lasting about 100,000 years. The results were as clear as they were fascinating.
The range of natural fluctuations: Over the past 420,000 years, CO₂ concentrations have fluctuated between approximately 180 ppm during glacial periods and about 280 ppm during interglacial periods, with an absolute maximum of around 300 ppm about 323,000 years ago. Temperatures at the Vostok Station were 8–10 °C lower during the ice ages than during the warm periods. This range was never exceeded throughout the entire measurement series. The current value of over 425 ppm (as of 2025) is unprecedented within this range.
The rhythms of the ice ages: These regularly recurring cycles confirm the Milanković theory: slight changes in the Earth’s orbit and the tilt of its axis influence solar radiation in the Northern Hemisphere and trigger the alternation between ice ages and interglacial periods. This is largely undisputed in the scientific community—the orbital cycles are the primary driver of climate change.
Methane and CO₂ – similar, but not the same: Both CO₂ and methane (CH₄) fluctuate in step with climate cycles. What is striking, however, as geologist Euan Mearns (2014) detailed, is that methane and temperature are extremely closely correlated and fluctuate together with virtually no time lag, whereas CO₂ exhibits a more complex, partially decoupled behavior. Petit et al. noted these differences as early as 1999 but did not discuss them in detail.
CO₂ and Temperature: Which Comes First, Which Follows?
The temporal relationship between CO₂ and temperature in the Vostok ice core is one of the most hotly debated issues in paleoclimatology. The answer is more nuanced than it appears at first glance—and it depends on whether one is looking at the warming or cooling phases.
At the onset of glaciation (cooling): The evidence here is clear and undisputed in the scientific community. In their original study, Petit et al. (1999) noted that, at the onset of glaciation, CO₂ lags behind temperature by several thousand years. The temperature drops first to glacial levels, while CO₂ remains at high levels for a long time. Mearns (2014, 2017) quantified this lag in detail: During the transition from the Eemian interglacial to the last major glaciation, CO₂ lagged behind temperature by approximately 8,000 years; upon closer analysis, this lag exceeded 14,000 years. Full glacial conditions set in without falling CO₂ levels contributing as a climatic driver. This fact is difficult to reconcile with the notion that CO₂ has been a dominant amplifier of cooling in natural cycles.
Regarding termination (warming): The situation here is more complex and is interpreted differently in the scientific community.
Previous research found a clear lag: Fischer et al. (1999) determined that the lag between the rise in CO₂ and temperature was 400 to 1,000 years during the last three terminations. Caillon et al. (2003) used argon isotopes in the Vostok core to measure the timing of Termination III (~240,000 years ago) and found that the rise in CO₂ lagged behind Antarctic warming by 800 ± 200 years. Mudelsee (2001) determined a lag of 1,300 to 5,000 years over the entire 420,000-year record.
More recent research has reached a different conclusion: Parrenin et al. (2013) developed an improved age scale based on five Antarctic ice cores and found no significant time lag between CO₂ and temperature during the last deglaciation—within a margin of error of 90 to 160 years, both rose virtually in sync. Pedro et al. (2012) and Shakun et al. (2012) also supported this finding. The discrepancy with the older studies is largely explained by uncertainties in dating: Since temperature is derived from the ice’s isotopes and CO₂ from air bubbles that are only trapped at a depth of about 90 meters, there is always an age difference between the ice and the gas that is difficult to determine precisely.
So what is the answer? The honest conclusion is this: during cooling phases, CO₂ levels clearly lagged behind temperature changes by thousands of years—that much is undisputed. During warming phases, the question of the temporal sequence is controversial depending on the dating method and the time window examined: Older studies found a lag of hundreds to around a thousand years, while newer studies find an almost synchronous development. What no one disputes: Orbital cycles were the primary driver of natural climate fluctuations, as described by the Milankovitch cycles. CO₂ was not the trigger—it was a consequence of the temperature change (via outgassing from warmer oceans) and acted, at least according to the prevailing scientific interpretation, as an amplifier that propagated the initial orbital impulse globally. The extent of this amplifying effect remains a subject of debate in the scientific community.
Today's Message
What do these findings mean for the present? Regardless of how one assesses the amplifying role of CO₂ in natural cycles, the Vostok ice core provides a finding that is undisputed: over the past 420,000 years, the CO₂ concentration has never exceeded the 300 ppm mark. The pre-industrial level was around 280 ppm—in line with natural interglacial values.
In May 2025, the atmospheric CO₂ concentration at the Mauna Loa Observatory in Hawaii reached a new record high of 430.5 ppm. The global annual average for 2024 was 422.8 ppm—about 50% above pre-industrial levels. These values are not only unprecedented in the 420,000-year history of the Vostok ice core, but according to recent research, they exceed anything the Earth has experienced in the last 3.3 million years.
The rate of the increase is just as remarkable as the absolute level. Natural increases in CO₂ at the end of the ice ages took place over thousands of years—whether they followed warming by centuries or occurred almost simultaneously. The current increase—from 280 to over 425 ppm—has occurred in less than 200 years, which is about a hundred times faster than any natural change in the ice core record.
This is the key difference from the past: In natural cycles, CO₂ was a consequence of temperature change—released from warming oceans and absorbed by cooling ones. Today, the cause is different. Through the burning of fossil fuels, we humans have independently and massively introduced CO₂ into the atmosphere—without an orbital trigger, without preceding natural warming. We have reversed the order: CO₂ is leading the way, at a speed and on a scale for which there is no parallel in the entire ice core record. Ice cores alone cannot answer how the climate system will respond to this unprecedented intervention.
And beneath the ice: Lake Vostok
The drilling at Vostok Station led to a second, entirely different discovery. Beneath the ice sheet, which is over four kilometers thick, lies Lake Vostok—a vast body of freshwater that has been isolated from the Earth’s surface for at least 15 million years. The lake covers an area of approximately 12,500 square kilometers and is over 900 meters deep at its deepest point.
LEhAN (CC BY-SA 4.0)
Although the water temperature is around −3 °C—below the normal freezing point—the water remains liquid because the enormous pressure from the ice above lowers the melting point, and geothermal heat from the Earth’s interior prevents it from freezing. When Russian scientists first drilled through the lake’s surface in 2012, the pressurized water shot up into the borehole and froze there—forming a natural seal.
Initial analyses of accretion ice (ice formed on the underside of the ice sheet by the freezing of lake water) provided evidence of microorganisms. The question of whether Lake Vostok harbors a self-sustaining ecosystem that has been isolated for millions of years continues to fascinate scientists to this day—not least because the conditions there bear similarities to the oceans beneath the ice of Jupiter’s moons.
What the ice core teaches us
The Vostok ice core drillings have fundamentally changed our understanding of Earth’s climate. They have shown that CO₂ and temperature have been closely linked over hundreds of thousands of years—in a relationship whose exact dynamics still occupy scientists. It is undisputed that orbital cycles set the pace. The extent to which CO₂ acted as an amplifier is still being investigated. What is beyond dispute, however, is the fact that today’s CO₂ levels far exceed anything recorded by the ice core over the past 420,000 years.
For me, as someone who documents changes in Swiss glaciers extensively and in real time on www.glaciers.today, this brings things full circle. The Vostok data provide the broad, historical context—the deep time in which the interplay of CO₂, temperature, and ice unfolded over hundreds of thousands of years. Our camera footage of the Pers and Morteratsch glaciers shows the consequences in the present: the visible, measurable retreat of the ice in a world whose atmospheric CO₂ concentration is unprecedented in the entire history of ice cores.
The Vostok ice core is a unique archive—and an invitation to study the data yourself, weigh the various interpretations, and grasp the implications.
Sources and further reading
Petit, J.R. et al. (1999). Climate and atmospheric history of the past 420,000 years from the Vostok ice core, Antarctica. Nature, 399, 429–436. nature.com
Barnola, J.-M. et al. (1987). Vostok ice core provides a 160,000-year record of atmospheric CO₂. Nature, 329, 408–414. cdiac.ess-dive.lbl.gov
Fischer, H. et al. (1999). Ice core records of atmospheric CO₂ around the last three glacial terminations. Science, 283, 1712–1714. science.org
Caillon, N. et al. (2003). Timing of atmospheric CO₂ and Antarctic temperature changes across Termination III. Science, 299, 1728–1731. science.org
Mudelsee, M. (2001). The phase relations among atmospheric CO₂ content, temperature, and global ice volume over the past 420 ka. Quaternary Science Reviews, 20, 583–589. sciencedirect.com
Parrenin, F. et al. (2013). Synchronous change in atmospheric CO₂ and Antarctic temperature during the last deglacial warming. Science, 339, 1060–1063. science.org
Mearns, E. (2014). The Vostok Ice Core: Temperature, CO₂, and CH₄. Energy Matters, December 12, 2014. euanmearns.com
Mearns, E. (2017). The Vostok Ice Core and the 14,000-Year CO₂ Time Lag. Energy Matters, June 14, 2017. euanmearns.com
Vasiliev, N.I. et al. (2007). Deep drilling at Vostok Station, Antarctica: history and recent events. Annals of Glaciology, 47, 10–23. cambridge.org
NOAA Global Monitoring Laboratory – Trends in Atmospheric Carbon Dioxide. gml.noaa.gov
Scripps Institution of Oceanography – Keeling Curve. scripps.ucsd.edu
National Snow and Ice Data Center – Vostok Ice Core Data. nsidc.org
CDIAC / ESS-DIVE – Historical CO₂ Record from the Vostok Ice Core. cdiac.ess-dive.lbl.gov